
Description
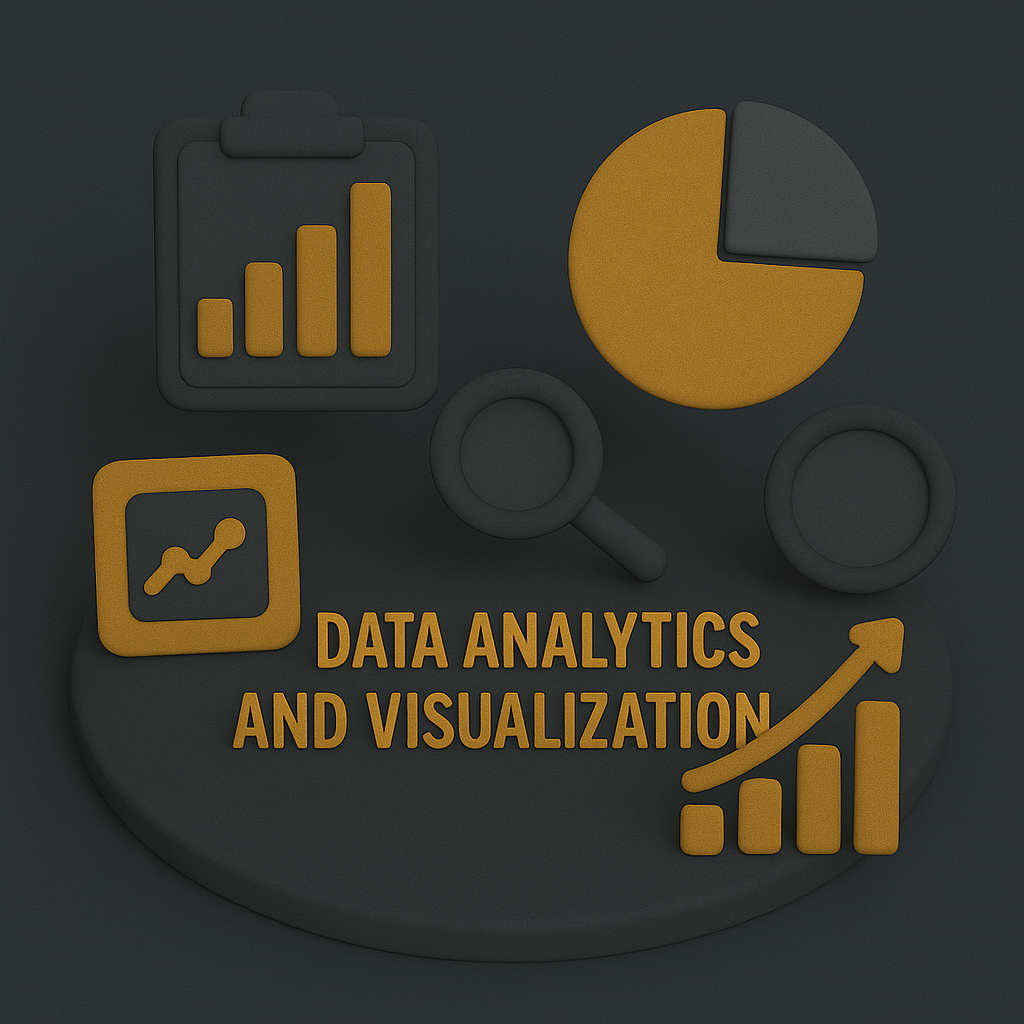
The Data Analytics and Visualization course teaches you how to transform data into decisions. You’ll learn to work with Python, Excel, and visualization tools like Tableau and Power BI. Through hands-on projects, you’ll analyze real data sets and discover actionable insights. The program includes cleaning, processing, and presenting information visually. You’ll practice creating dashboards and reports used in real business environments. By the end, you’ll be able to communicate complex data clearly and confidently.



Reviews
There are no reviews yet.